Understanding the nuances of carbon emissions and how they relate to farming practices is crucial for sustainable development in the agricultural industry. This guide will delve into the essential metrics of carbon accounting, including net emissions, total sequestration, and emission intensity, to help you enhance your environmental strategies.
What's your number? Understanding key carbon metrics
Knowing your farm’s carbon metrics is pivotal. Let’s break down what these numbers mean and why they matter.
What are net emissions?
Net emissions refer to the total greenhouse gas emissions produced on your farm. This includes all sources of emissions involved in the production process, from livestock management to the use of farming machinery. Tracking net emissions is vital for red meat producers to gauge the overall climate impact of their operations. By monitoring these emissions year over year, farmers can identify trends and implement strategies to reduce their carbon footprint.
The role of total sequestration in carbon accounting:
Total sequestration measures the amount of carbon dioxide that is captured and stored by the farm's vegetation and soils. This process offsets some of the farm's net emissions, providing a clearer picture of the farm's overall impact on the environment. For red meat producers, enhancing carbon sequestration can be a pathway to achieving carbon neutrality, thereby making their operations more sustainable.
Understanding emission intensity in agriculture:
Emission intensity is defined as the amount of greenhouse gas emissions produced per kilogram of product. This metric is crucial for understanding how efficiently a product is produced in terms of its environmental impact. For example, the emission intensity for red meat is often measured in tonnes of CO2 equivalent per kilogram of meat produced.
Industry standards for emission intensity:
Red meat producers must be aware of the typical emission intensity ranges for their products to benchmark their performance:
- Sheep meat: 6-10 kg CO2e/kg live weight (LW)
- Beef meat: 9-18 kg CO2e/kg LW
- Wool: 20-35 kg CO2e/kg greasy wool
- Grains: 315 kg CO2e/tonne of grain
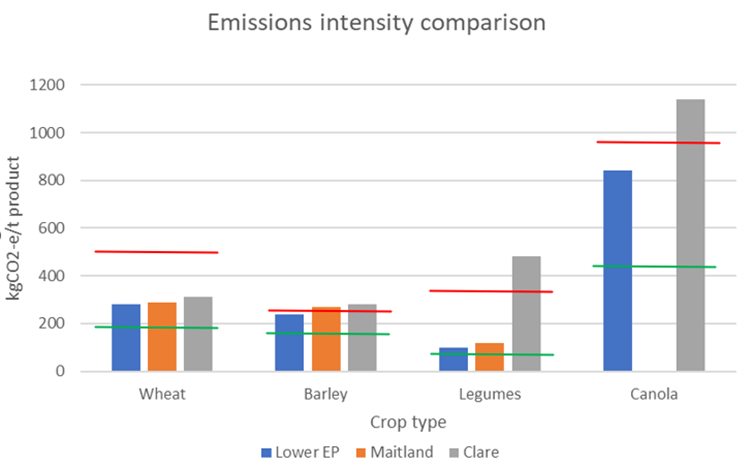
Additionally, regional emission intensity ranges for grains vary, providing specific benchmarks for areas like South Australia, where typical crops include wheat, barley, legumes, and canola.
For red meat producers, mastering carbon emissions and emission intensity is not just about regulatory compliance or environmental stewardship; it's also about economic sustainability and industry leadership. By understanding and optimizing these metrics, farmers can make informed decisions that enhance their productivity while minimizing their environmental impact.
By integrating comprehensive carbon assessments and striving for improvements in emission intensity, red meat producers can lead the way in sustainable agricultural practices, ensuring a healthier planet for future generations.
 Figure 1: Example emissions intensity comparisons between crop types in different locations overlaid with minimum (green line) and maximum (red line) regional emissions intensities for each crop type. Adapted from data collection and estimation conducted by Pinion Advisory and the National Grains Life Cycle Assessment project (NSW DPI).
Stay connected and stay supported with Sustainability Strategy
Contact the Sustainability Strategy team for more information:
1300 746 466
sustainability@pinionadvisory.com